The Z1 Dashboard software offers several special dashboards. These include the
telemetry dashboards (discussed here), the
track map dashboards
and the
timing and scoring dashboard. Each of these dashboards
provides detailed information that can be used to augment or replace the information
included in the car's main dashboard.
The Telemetry Dashboard 1 is included by default in the rotation of dashboards for the
first instance. It is also the primary dashboard for the
fourth instance.
You may alter these settings as described in the
Car Settings page.
to include both Telemetry dashboards in the rotation if you prefer. However you choose to display
this dashboard, the information is the same and is described below.
Compatibility with Sims
Note that even though the telemetry dashboards can be used with all sims, not all the
sims supply all the data that can be displayed by the dashboard. For example, iRacing
does not output tire temperature data, break temperature, or tire wear data. rFactor2
on the other hand outputs all data. Any data points that are not output by the currently
running sim will simply display their default values.
Telemetry Dashboard 1
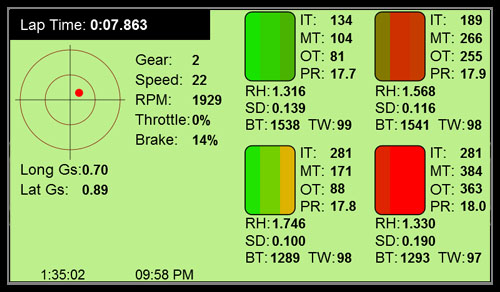
Friction Circle
The left side of the dashboard shows a friction circle which displays the lateral
and longitudinal g-forces exerted on the car. The inner circle represents 2.5Gs
and the outer circle represents 5Gs.
Below the friction circle the actual g-forces in both directions are displayed.
Tire Data
There are four tire images which graphically display the current tire temperature,
broken into the inner, middle and outer section of the tire. As the temperature
increases the color of that section of tire will change from light green, to dark
green, to yellow/orange to red. To the right of each tire are four lines, showing
the inner, middle and outer tire temperatures (IT, MT and OT). The fourth line (PR)
shows the current pressure of the tire.
Below each tire diagram are three lines. RH shows the current ride height of that
corner of the car. SD shows the current shock deflection of that corner of the car.
BT displays the current brake temperature for that corner's brake. TW shows the tire
wear for that tire. 100% if a new tire. As the tire degrades the percentage will
decrease.
General Data
In addition to the tire and g-force data, the telemetry screen also displays the current
gear, speed, RPM, throttle percentage and brake percentage for the car at that moment.
Telemetry Dashboard 2
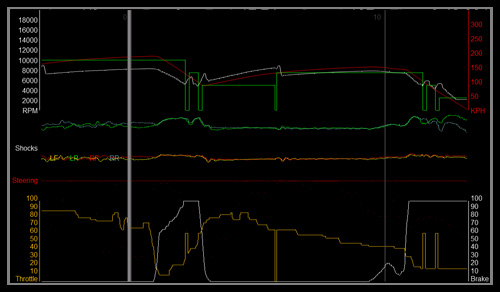
Top Graph
The top graph on the telemetry 2 dashboard display the car's RPM, speed and gear. The RPM
scale is in white on the left. The white line represents the current RPMs of the car.
The speed scale is in red on the right. The red line represents the current speed of
the car. The green line represents the current gear of the car.
Middle Graph
The middle graph displays the suspension deflection for the car and the steering position.
Each wheel has its own steering deflection line. The system will attempt to scale the lines
based on the car to keep all cars within the same area on the graph. The taller the line
the more the suspension is being deflected from its resting position. The steering line
shows steering movement of the car.
Bottom Graph
The bottom graph displays the throttle position graph in orange on the left. The orange
line is the current position of the throttle. The white graph on the right is the brake
graph. The white line displays the current brake application of the car.
 Manual Index