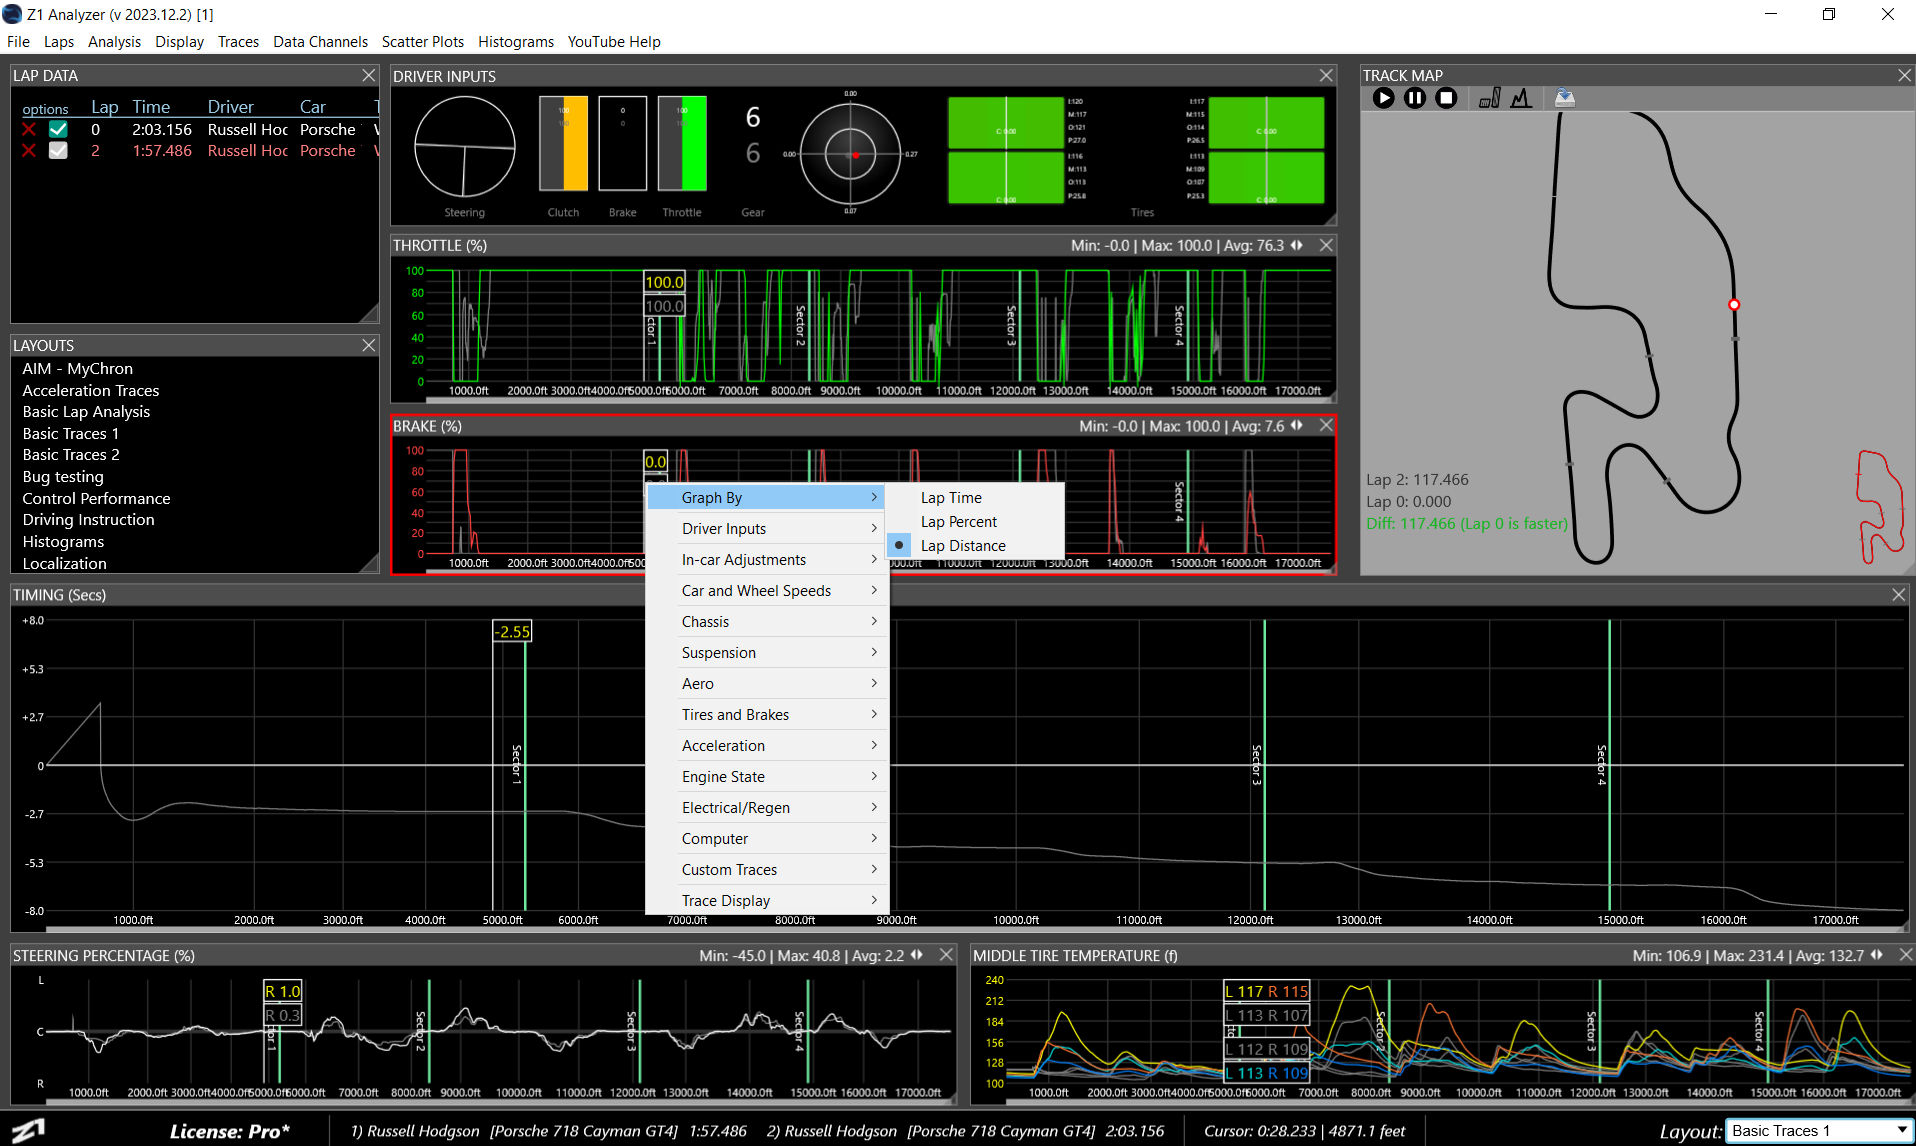
Traces are probably the most common item you will add to your layout. Any data channel, custom channel
or math channel can be displayed in a trace. The resulting graph makes it easy to see the data and compare
laps against each other.
The way in which the data is displayed can be customized in the Display tab of the settings dialog.
To add a trace select the Traces main menu, and then the Add Trace sub menu. The default data channels
are grouped together by category making it easy to find what you are looking for.
Once a trace is in the layout, you can easily modify it by right clicking and utilizing the popup menu.
Options here include the ability to switch between time, percent and distance graphing, maximizing
the trace, and changing what the trace displays.

You can zoom in on a trace with the mouse wheel, or by clicking and dragging over part of the trace.

Once zoomed in you'll see a scrollbar at the bottom fo the trace. You can uze this to scroll around the
trace in its zoomed in state.
Double clicking anywhere in the trace will restore it to its full view.

The title bar of the trace displays its name, and various details such as the minimum, maximum and average
values in the trace and current cursor position values. Click the double arrows at the top right of the
trace to cycle between these options.
 Manual Index


