All traces displayed in the Z1 Analyzer can include the minimum, maximum and average values displayed
on the specific trace. This information is shown in the title bar of the trace.
If you want to quickly find where these points occur within the trace, then turning on Trace Extents
is the answer. To do so select the Display->Show Extents menu option.
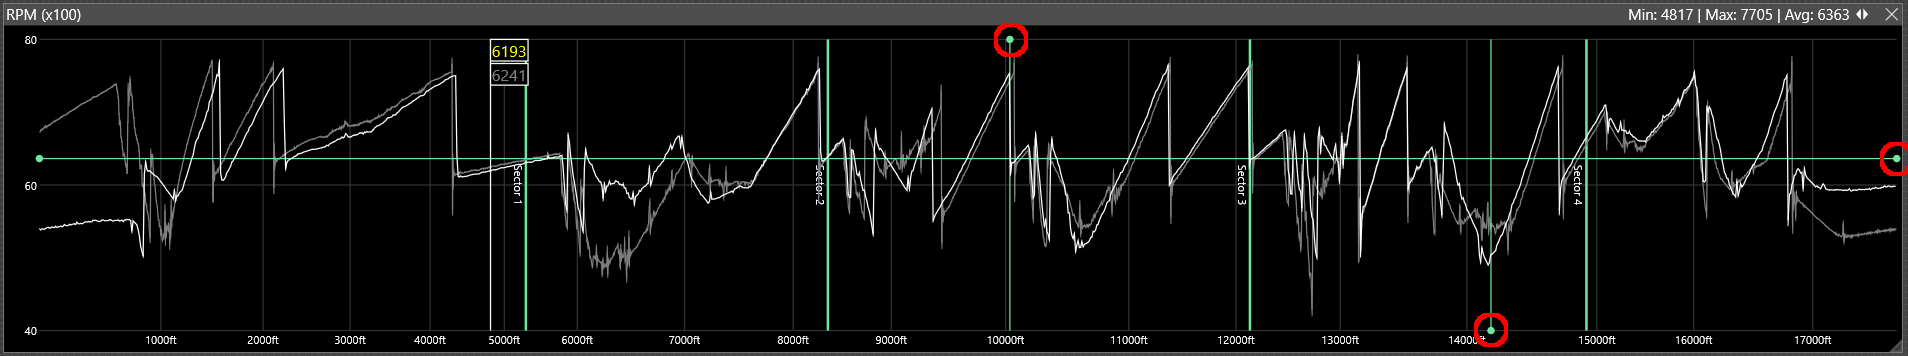
Trace Extents will show these three points on the trace. The minimum point will display as a vertical
line with a green circle at the bottom. The maximum point will display as a vertical line with a green
circle at the top. The average will display as a horizontal line with a green circle at the right.
Note: In the image these circles are highlighted in red for easy identification. Thes red highlight circles
do not appear in the Z1 Analyzer.
 Manual Index