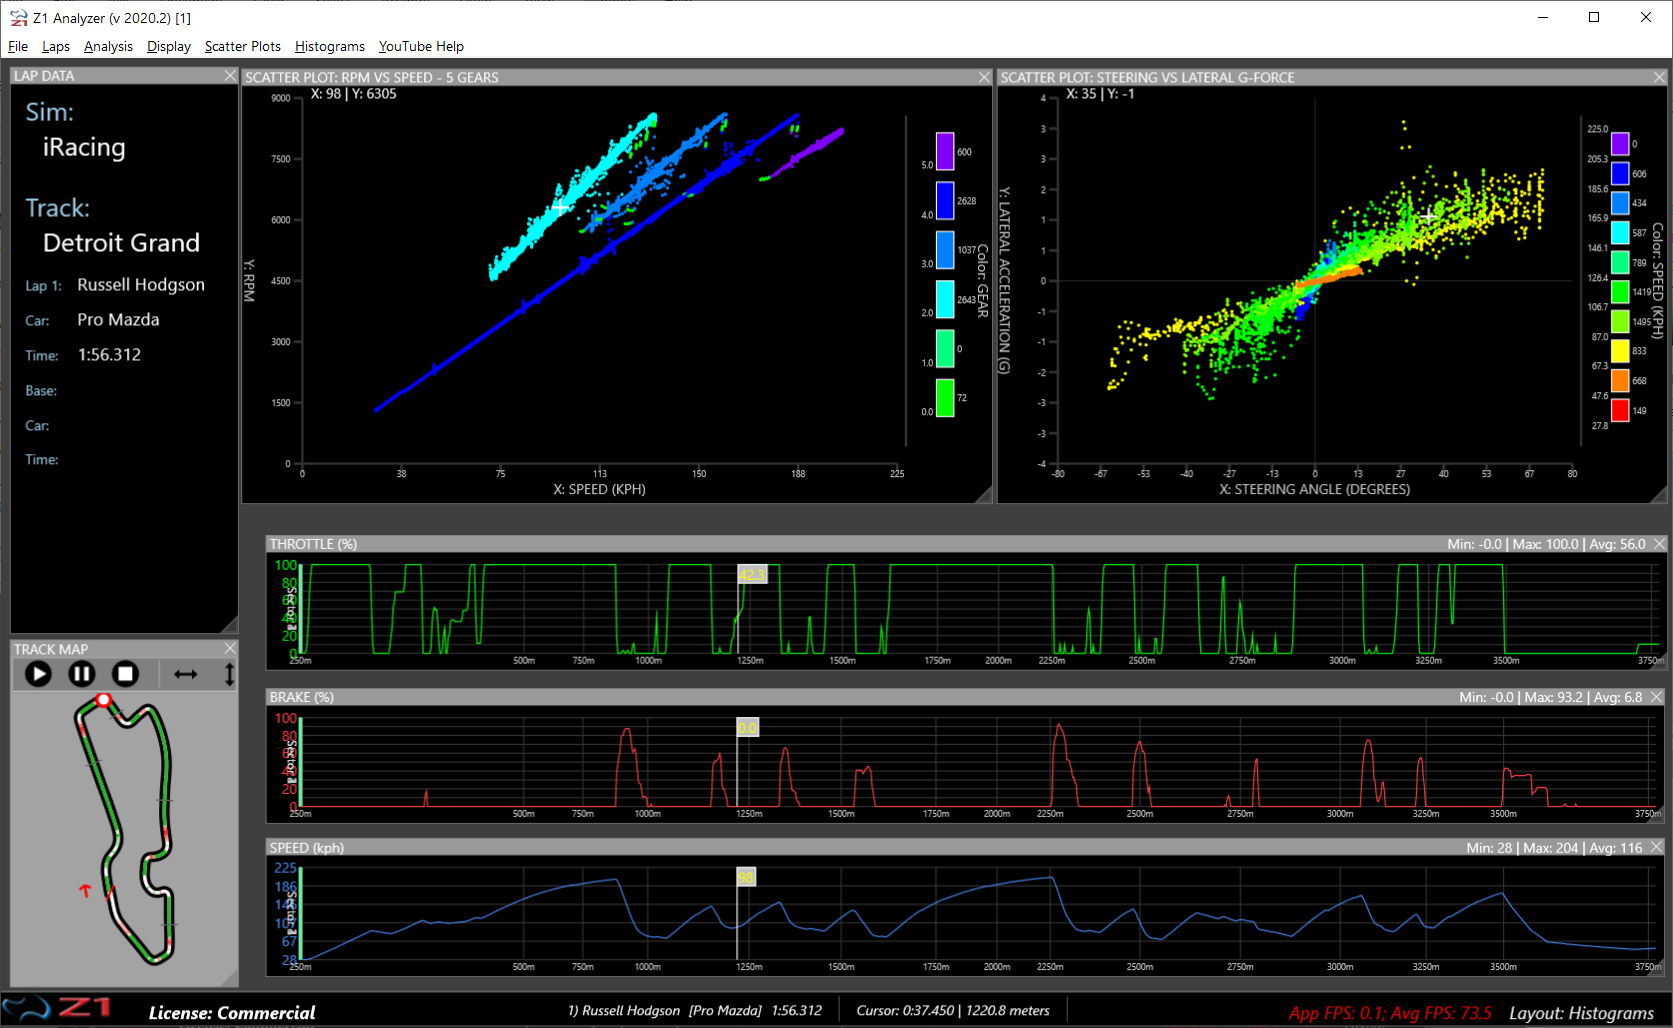
Scatter Plots are an integral part of telemetry analysis and the Z1 Analyzer provides you with the ability
to easily create and view them. Access all their options under the Scatter Plots main menu.
There are several pre-defined scatter plots included with the Z1 Analyzer. You can also create your own scatter
plots or modify the existing ones using the Scatter Plots->New Scatter Plot or Scatter Plots->Edit Scatter Plot
menu options.
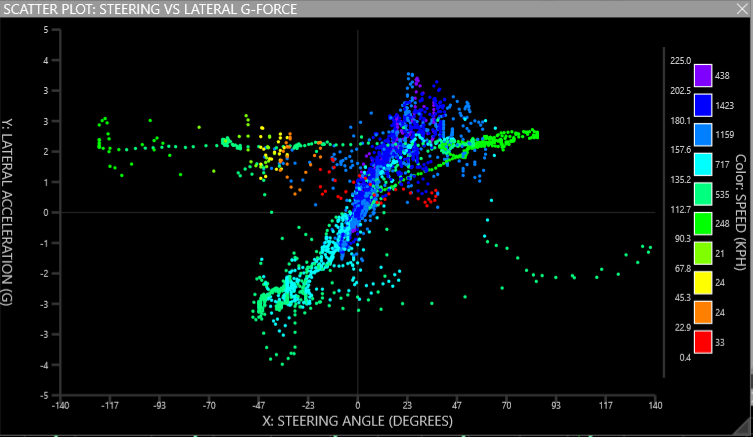
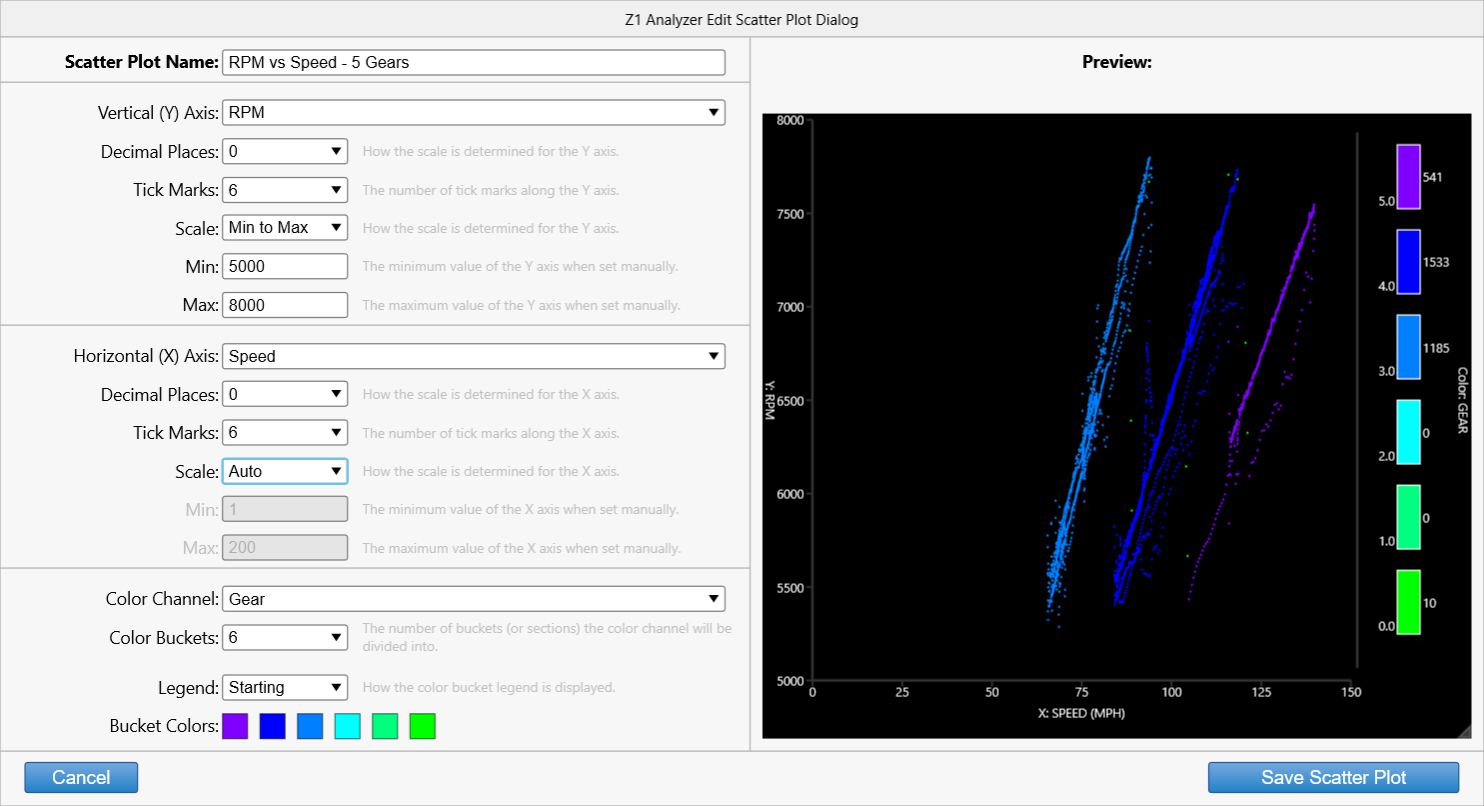
Scatter plots are highly customizable in the Z1 Analyzer. You can choose which data channels are displayed on the
X and Y axis, as well as selecting an optional color data channel. For each axis you can specify the number of decimal
places, tick marks, and the scale used.
The optional color channel lets you specify the number of buckets used, the color of each of those buckets and the
way in which the data in the color channel is sorted into each bucket.
 Manual Index