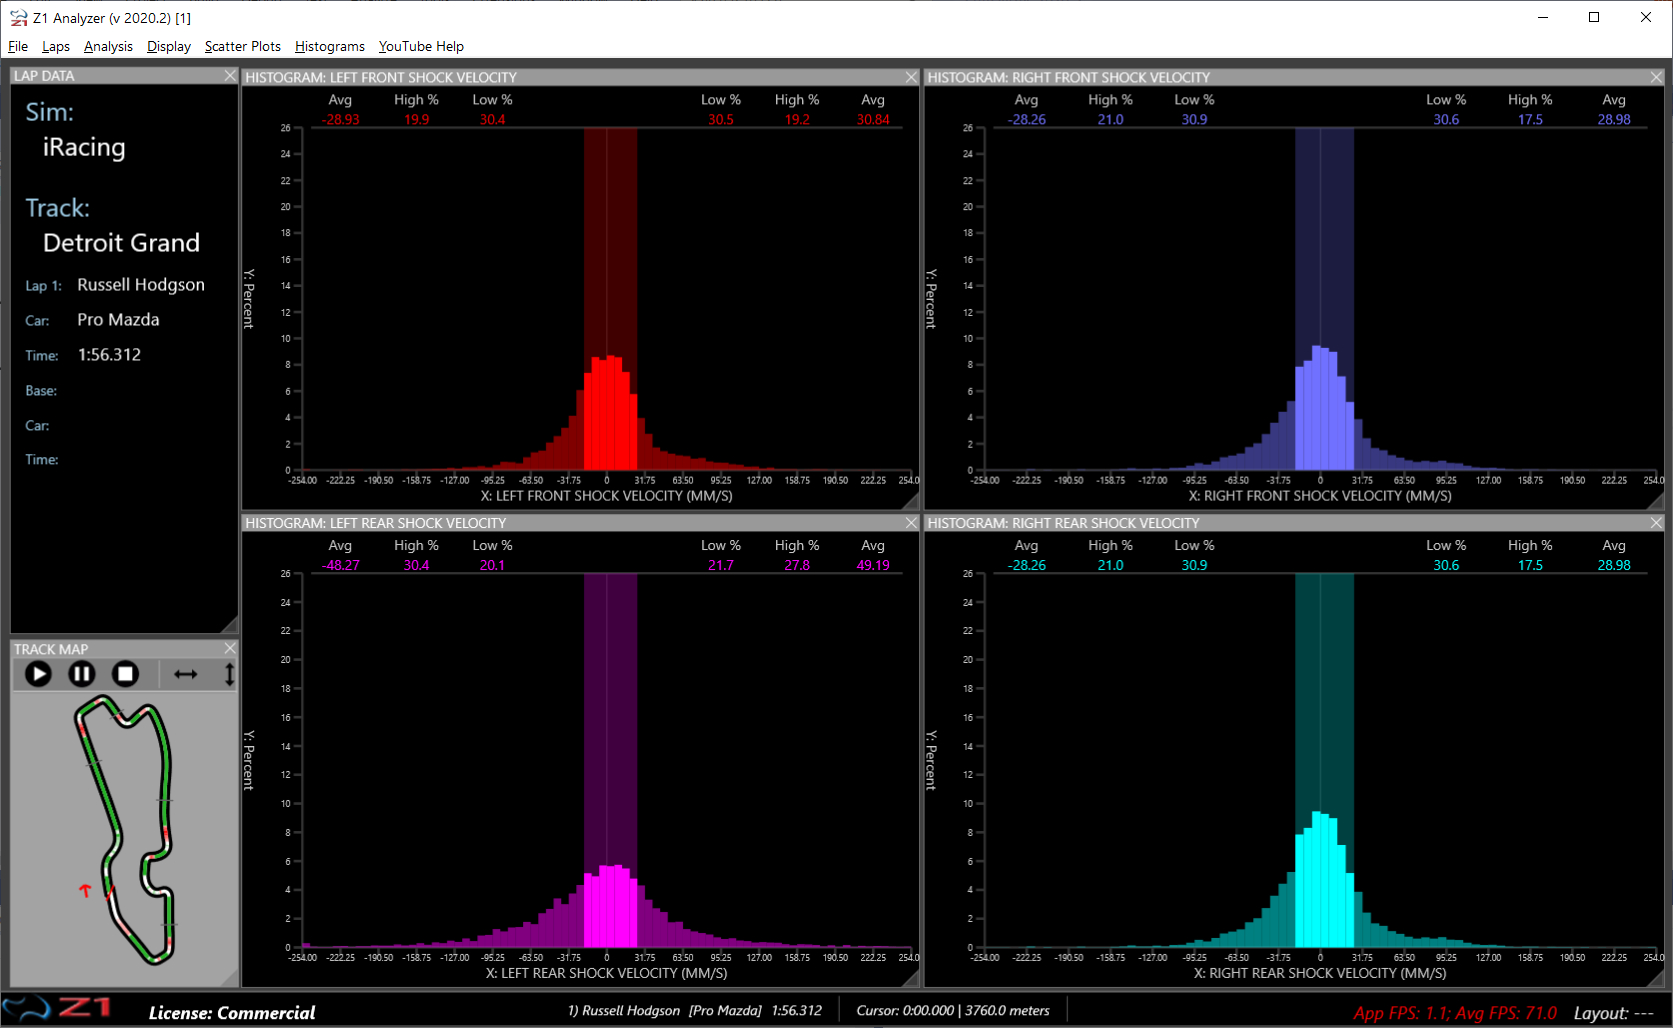
Histograms are a great way to easily view information on data channels, especially suspension related
information. The Z1 Analyzer provides you with an easy way to create and view a histogram of any available
data channel. Access all their options under the Histograms main menu.

The Z1 Analyzer includes several pre-defined histograms, allowing you to get started quickly and easily.
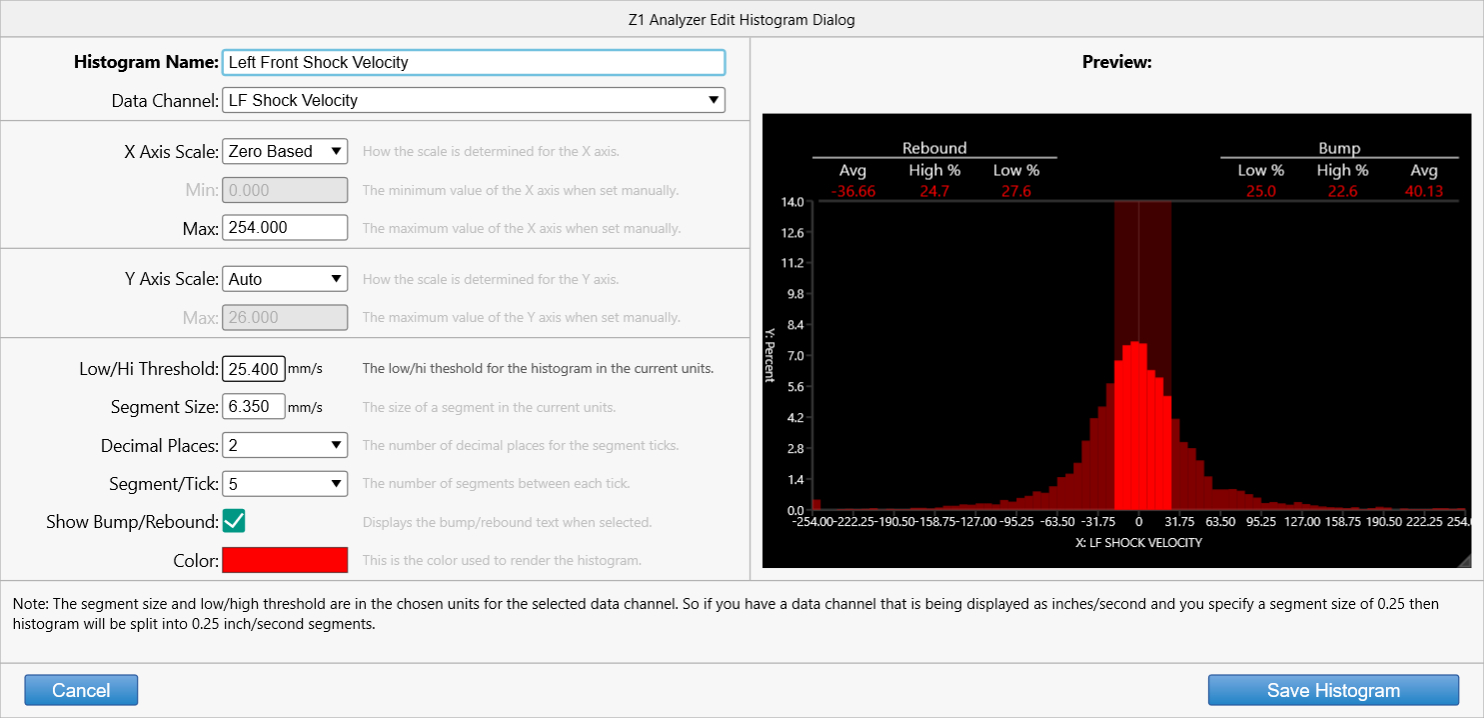
You can create your own histograms or modify the existing ones using the Histograms->New Histogram or
Histogram->Edit Histogram menu options.

The histograms are completely customizable. You can choose the data channel, axis scale, hi/low threshold,
segment size, segments per tick, units, decimal places and color used. Using these options the Z1 Analyzer
provides you with the ability to displasy a histogram of any data channel just the way you want it.

 Manual Index


