What makes a great telemetry application? One that helps you go faster without requiring a PhD in physics.
That is exactly what the Z1 Analyzer does with the new Lap Analysis section. You'll a description of your
lap in plain English along with a comparison to any other loaded lap.
The Analysis menu provide access to all of the following screens.
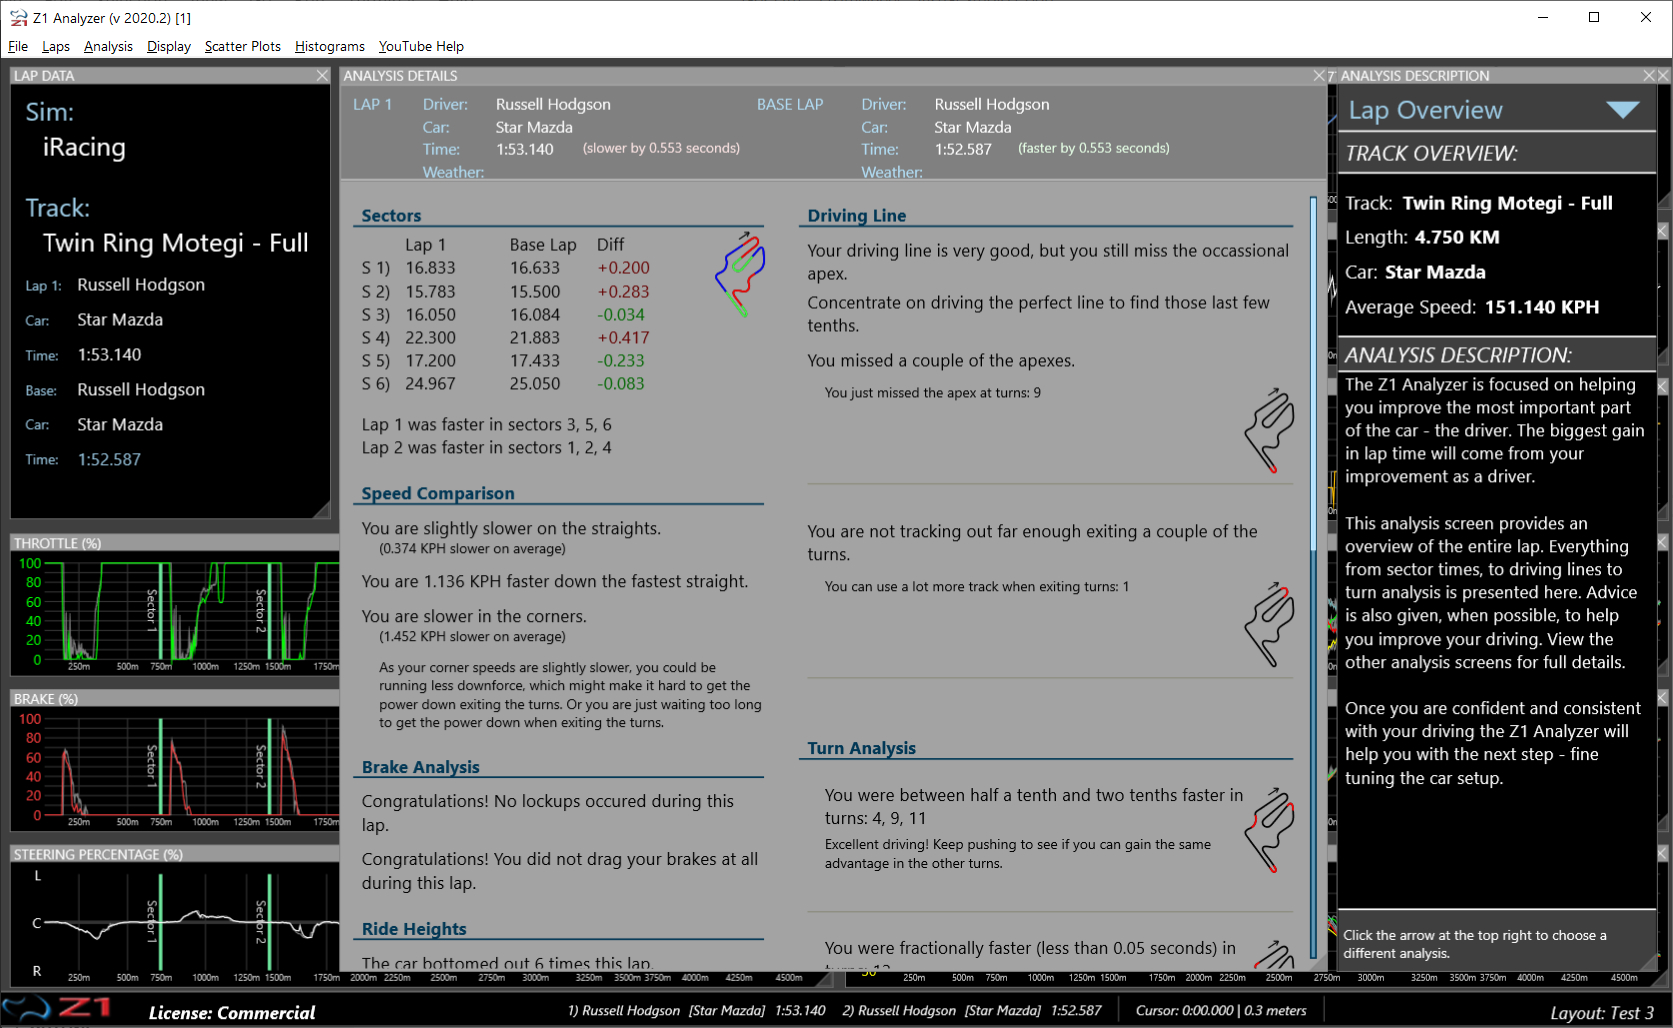
Lap Overview
The Lap Overview section is the starting point of the analysis section. It gives you an overview of your
lap in English. It includes paragraphs on your sectors, driving line, turns analysis, speed, brake lockups
and ride heights. Once you've read this section, you can view more details by selecting a new section
from the drop down menu at the top right of the screen.
Track Walk
This track walk analysis screen allows you to view detailed information about each turn. The idea being
that you can virtually walk through each turn in the track before driving it in order to help determine the
best way to take each turn.
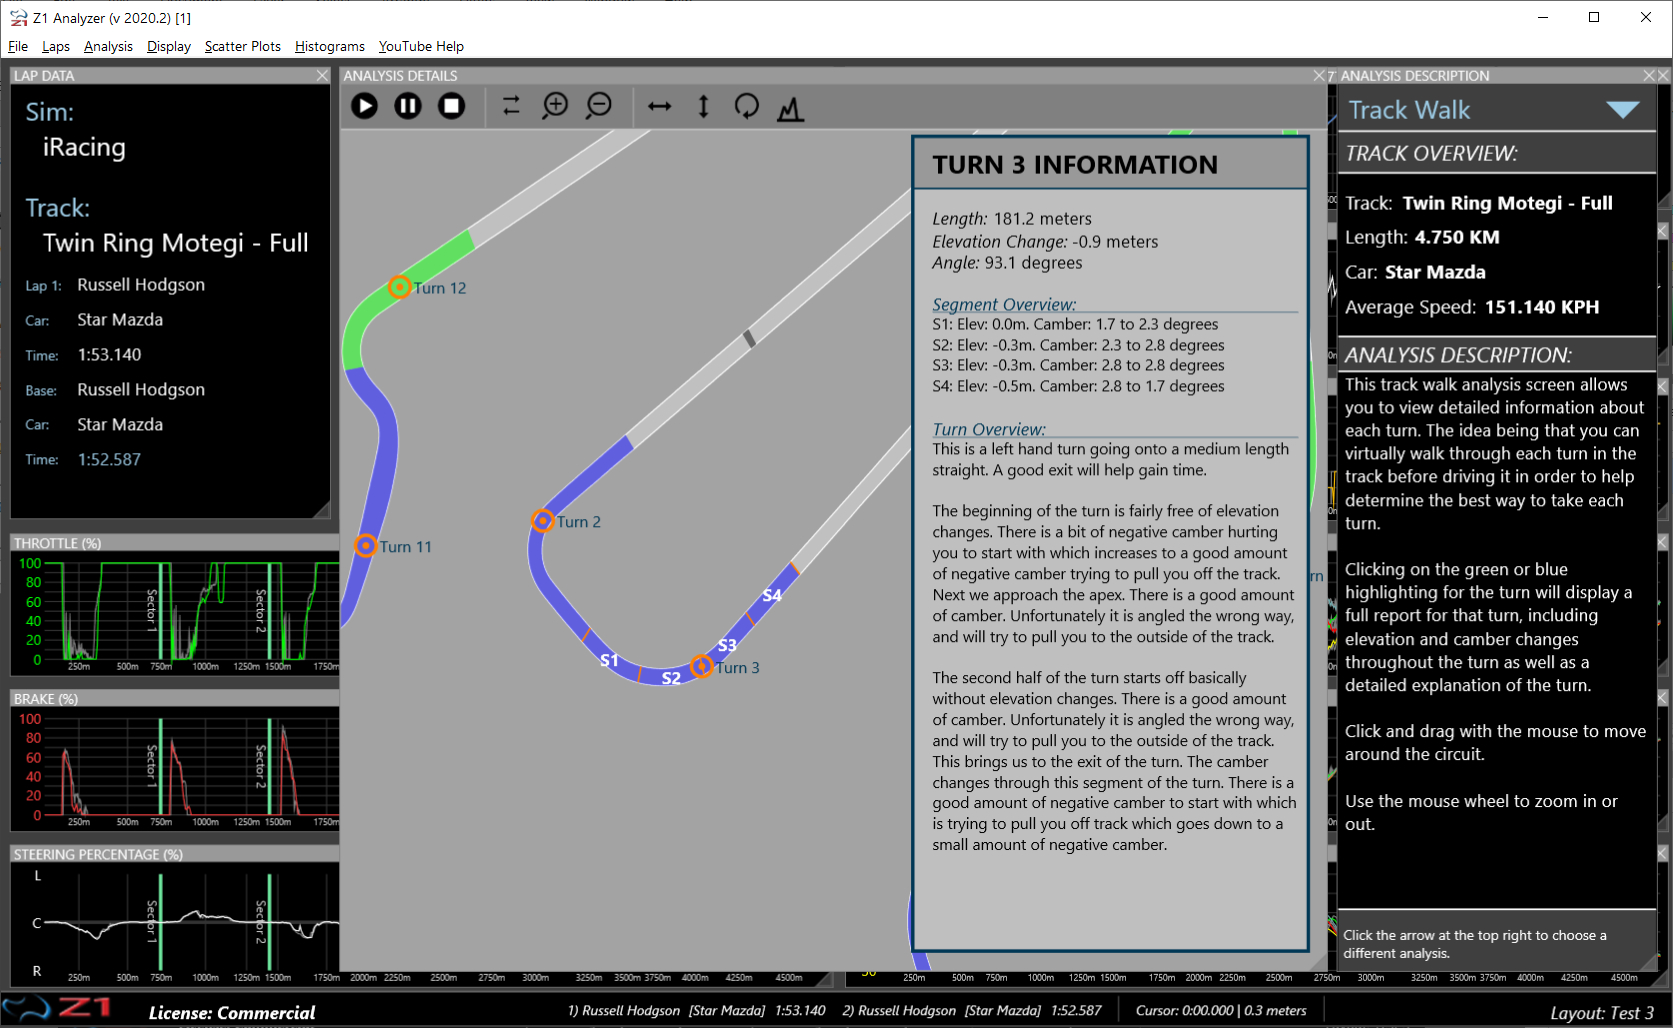
(Note this feature is not available for all sims).
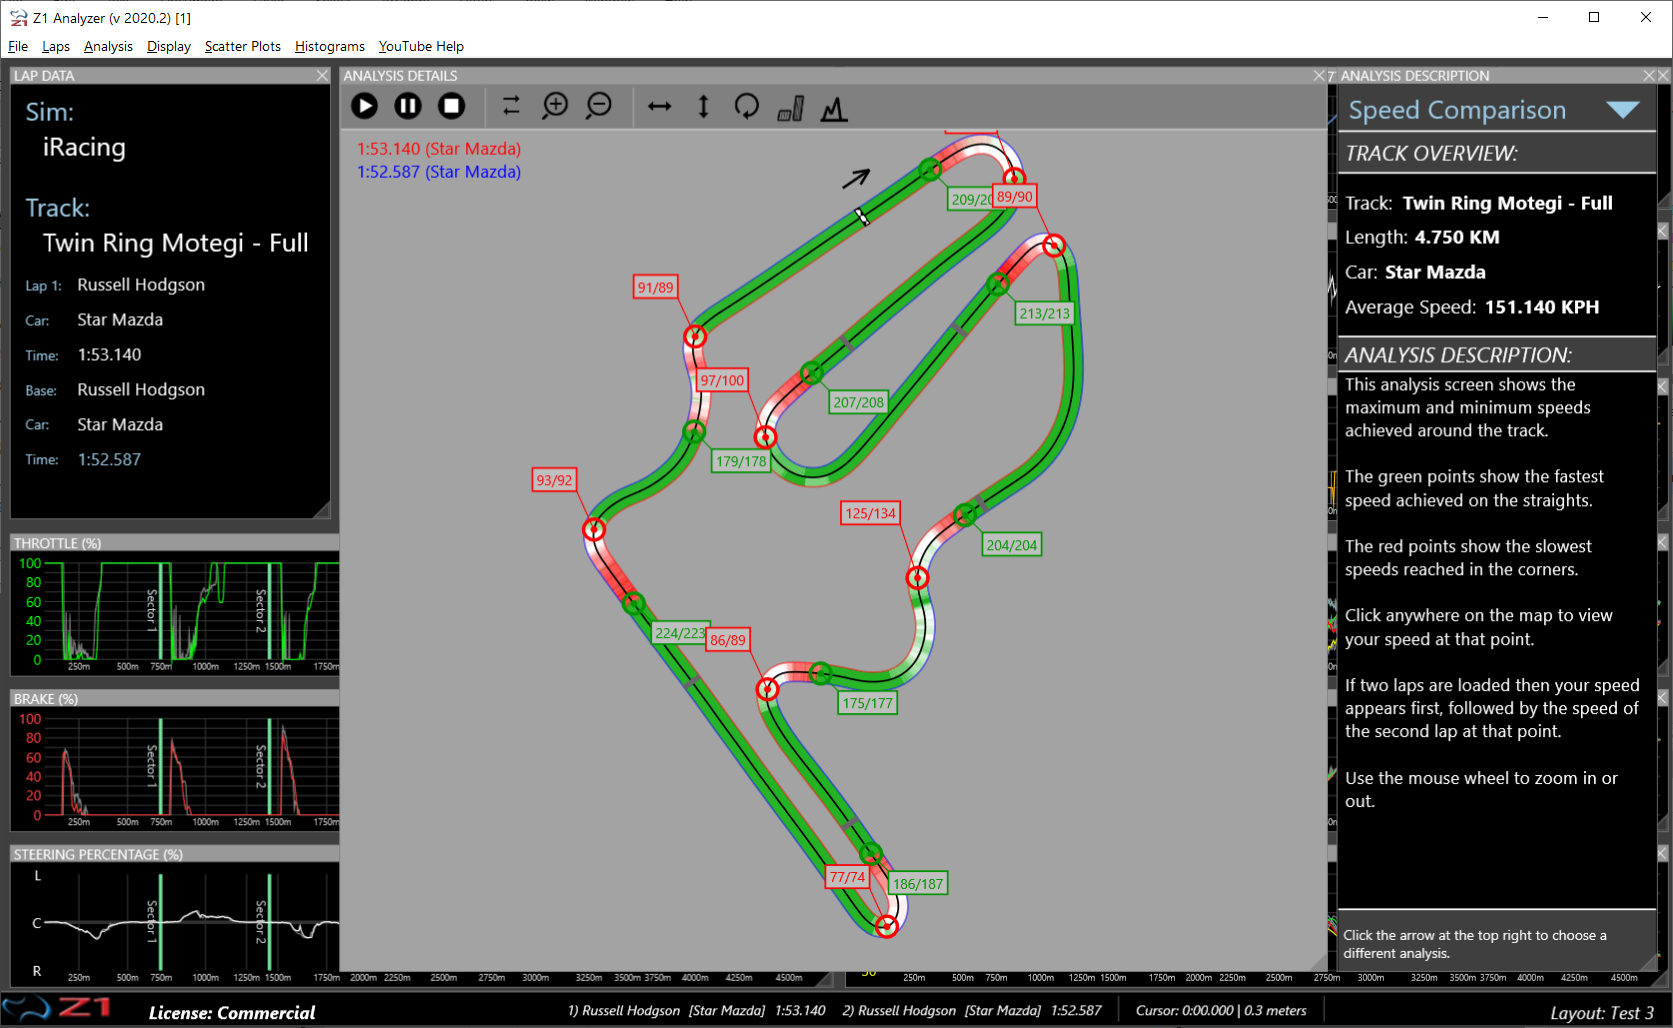
Speed Comparison
This analysis show the top speed you reach at the end of straights, and the slowest speeds you reach
in the turns. If you have a second lap loaded you will also see the speeds that the car from the other
lap is doing at the same point on the track. This lets you easily see where you are faster or slower.
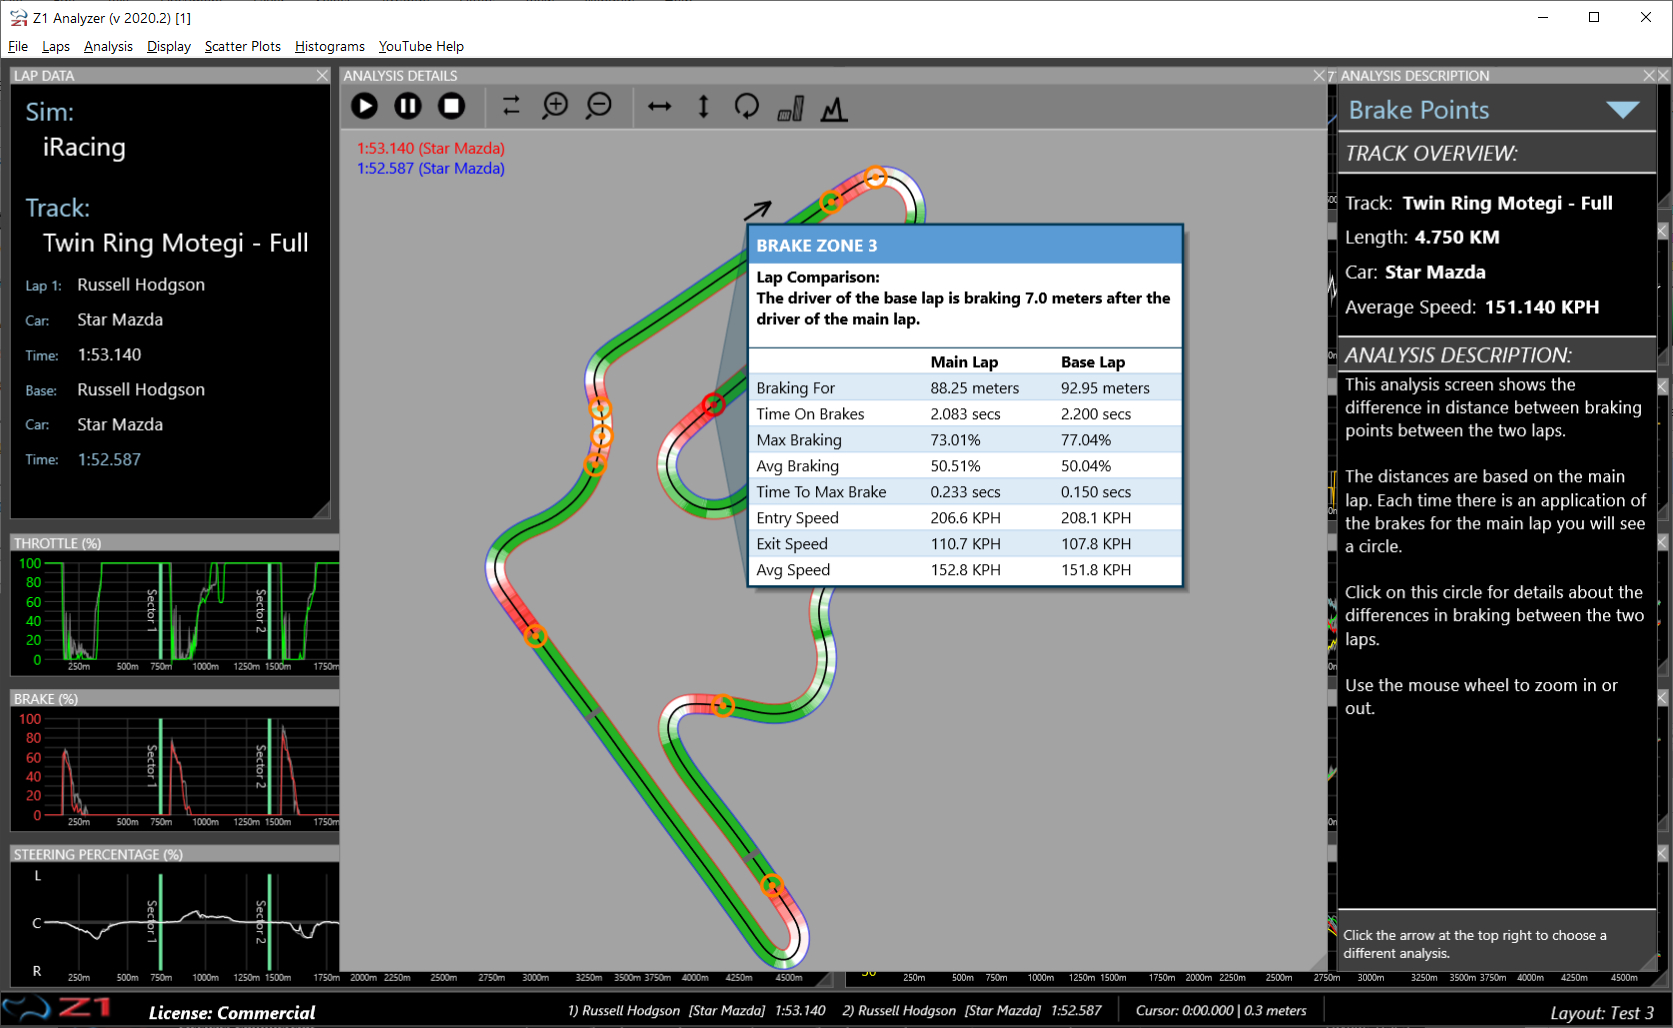
Brake Points
This analysis screen shows the difference between braking points of two laps. Information compared
conaists of brake distance, time on the brakes, maximum and average braking, time taken to get to maximum
braking and entry, exit and average speed in the brake zone.
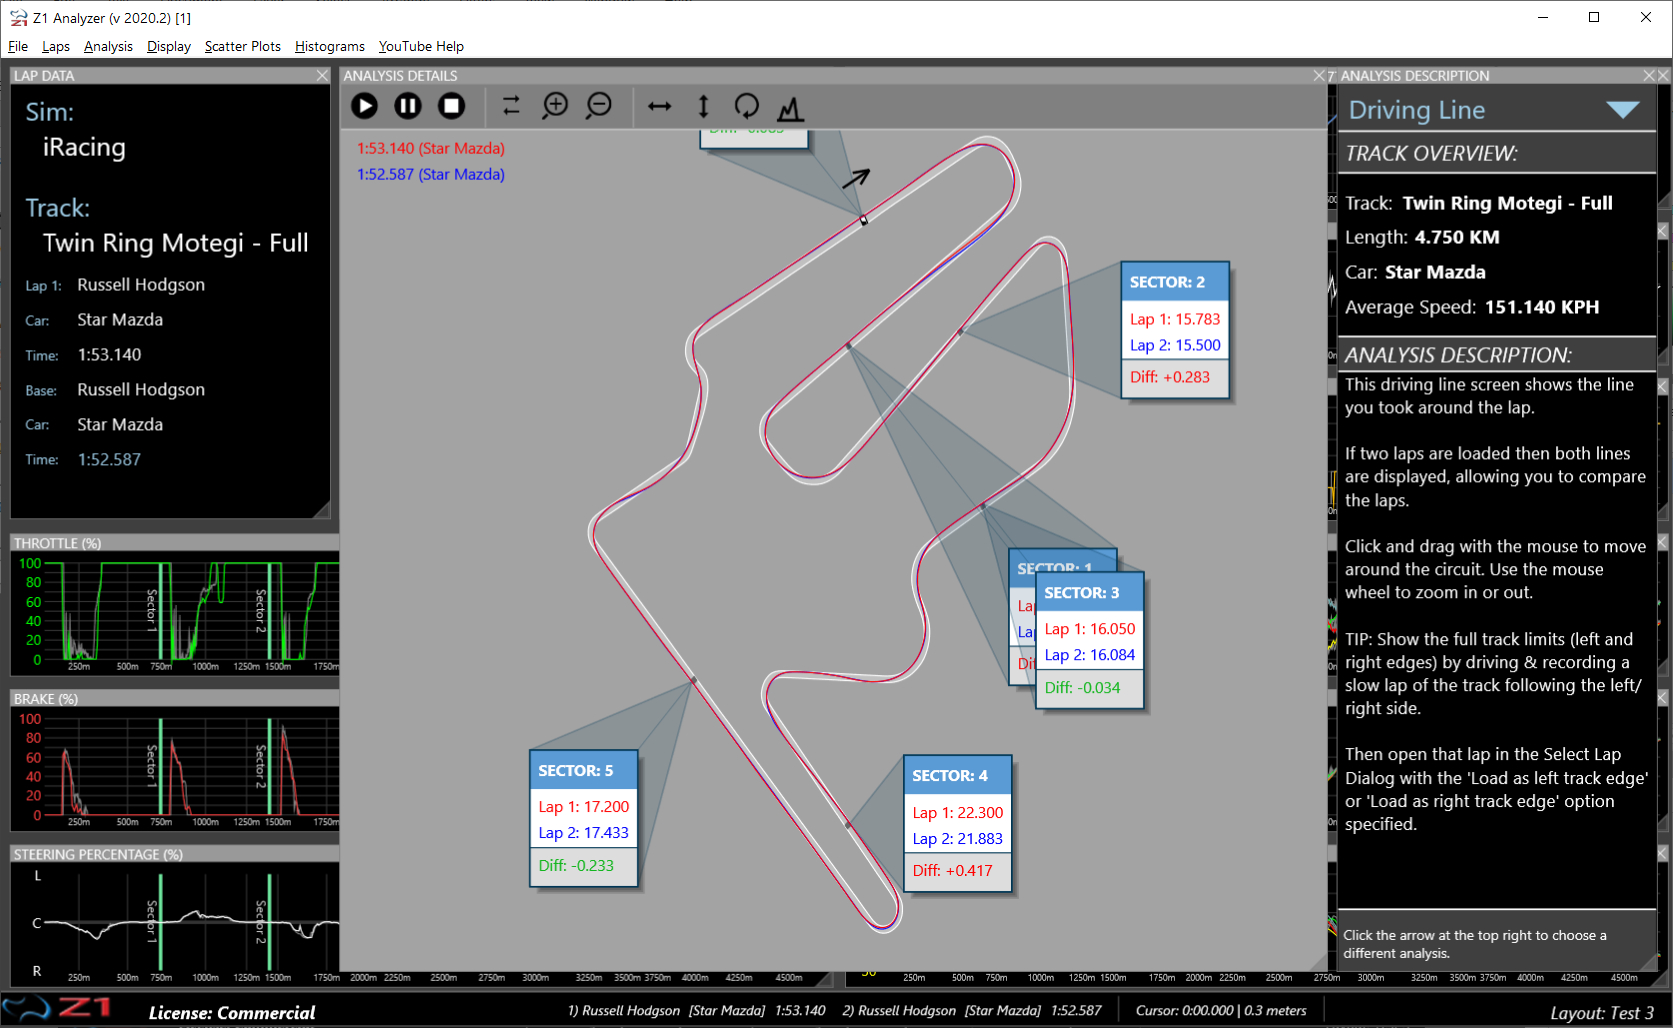
Driving Line
This analysis shows you your driving line around the track. And it isn't just a line floating in space.
It also allows you to see the edges of the track. This is vital as you can then see if you are using all
of the track. In addition sectors are marked along with the times taken in each one. If two laps are loaded
then both driving lines are shown, allowing you to compare them.
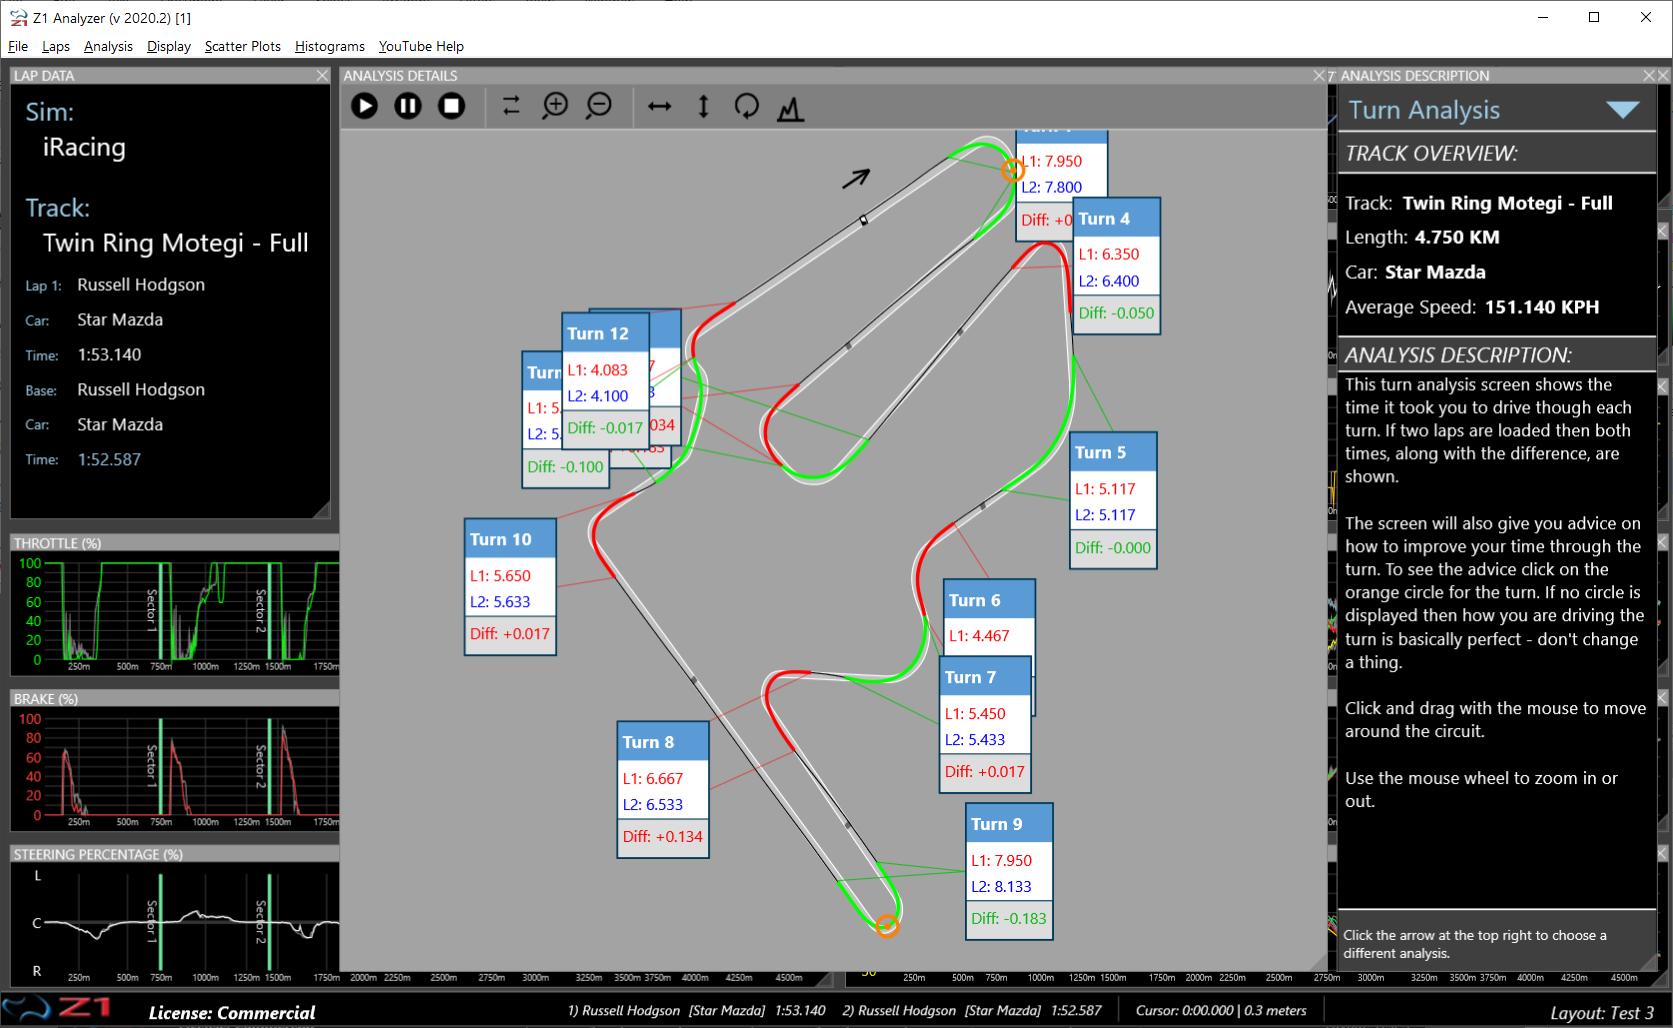
Turn Analysis
This analysis shows you the turns in detail. Just as with the driving line you can see the full extent
of the track with your driving line overlaid. The Z1 Analyzer will then focus on each turn, telling you
how long it took to negotiate each one. If two laps are loaded then the difference in time is also displayed.
Finally if the Z1 Analyzer has advice for you on how to improve the turn you will see an orange circle.
Click that circle to see the advice.
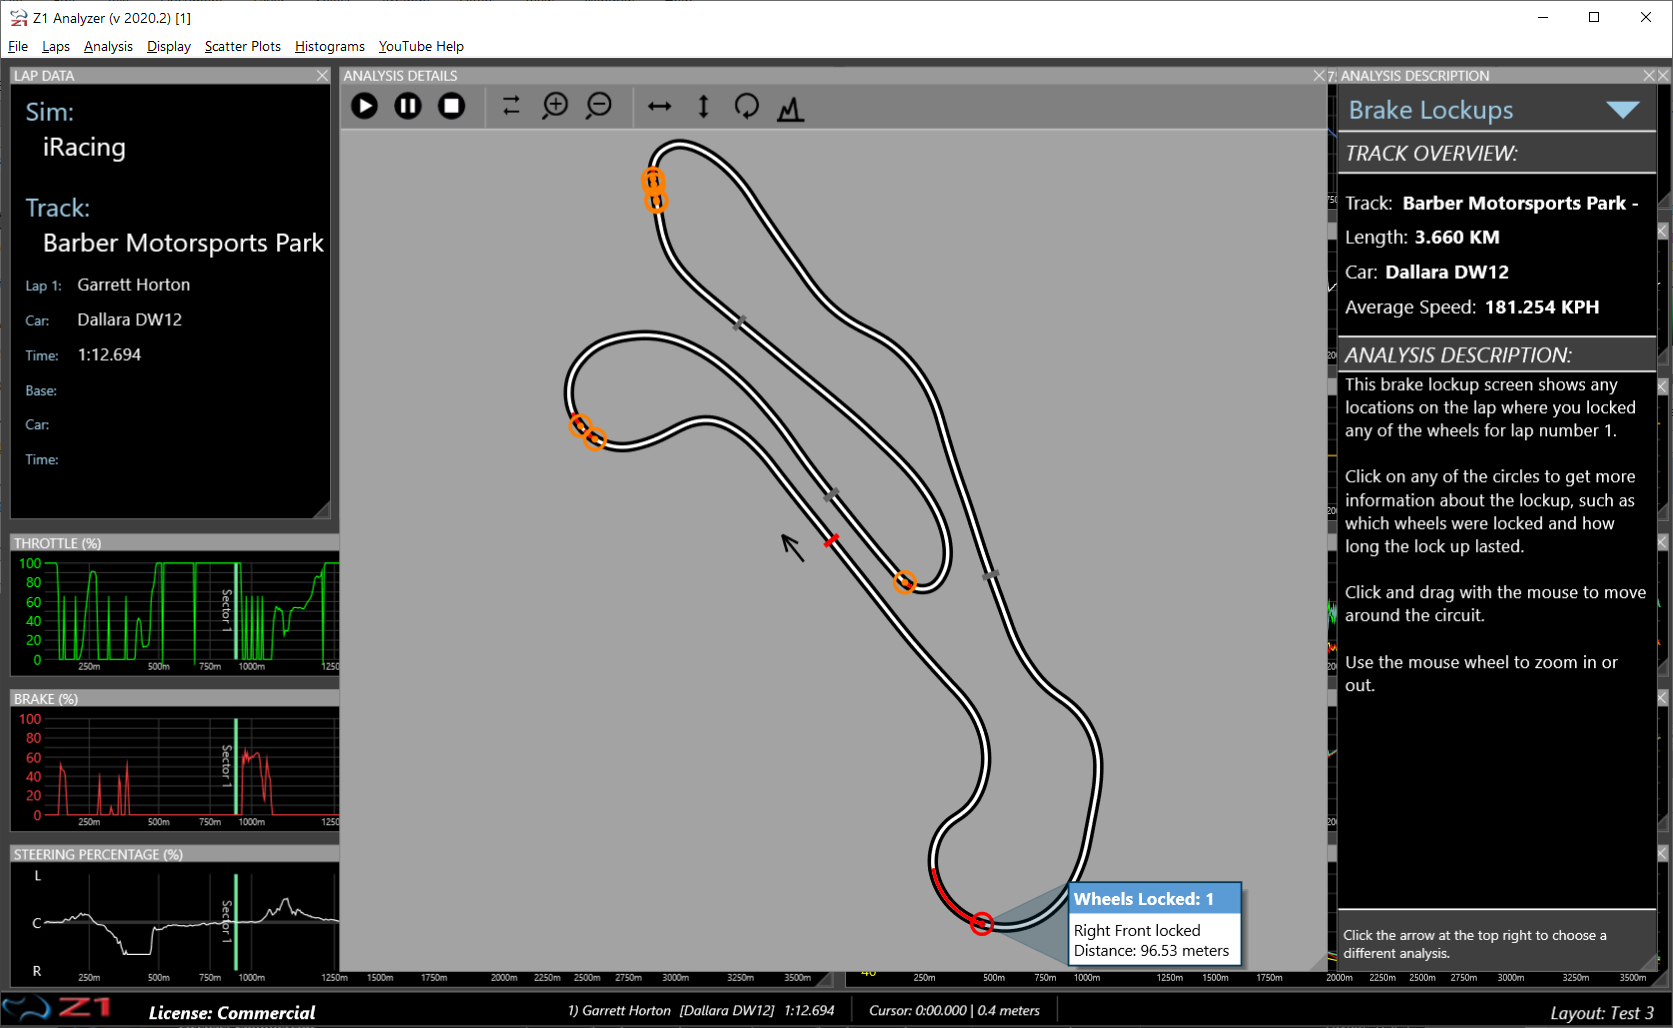
Brake Lockups
This analysis screen shows you any brake lockups that may have happened during the lap. If you see
an orange circle, that means you locked one or more wheels at that point. Click on it to see the details
of the lockup.
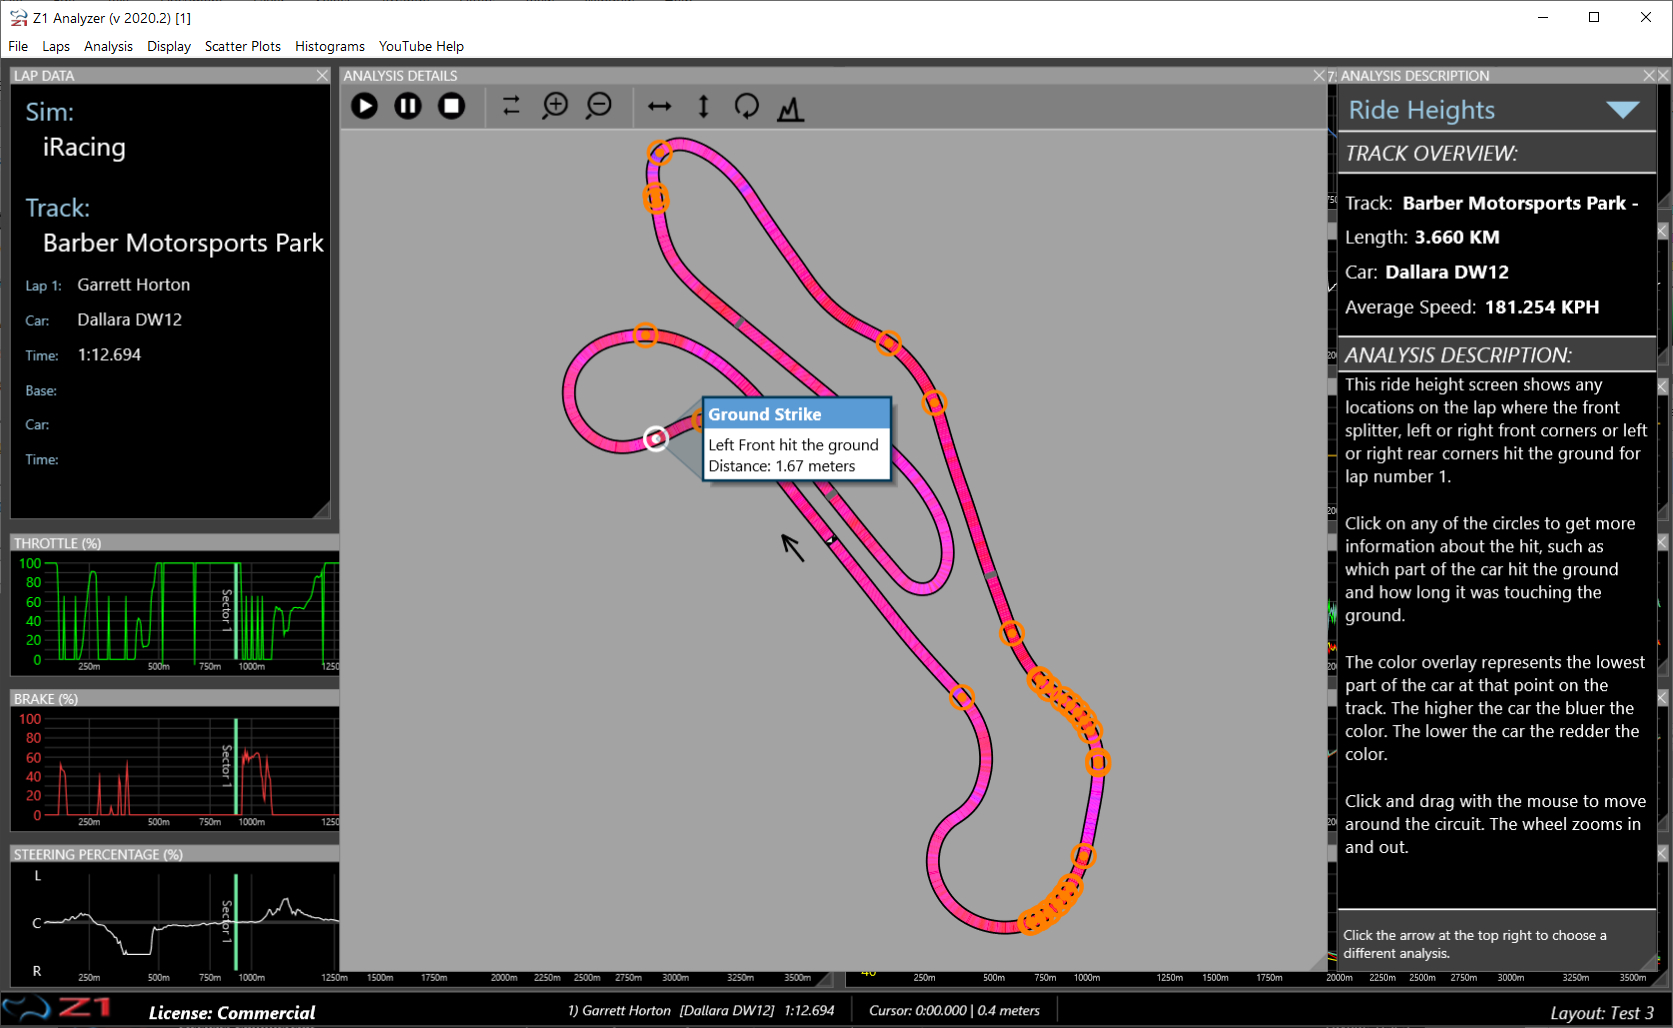
Ride Heights
This analysis screen shows you the ride heights of the car as you progress round the lap. A color overlay
going from blue (for most ground clearance) to red (for least ground clearance) is displayed. If any part of
the car hit the track at any point you will see an orange circle. Click on that circle to see more details.
 Manual Index